
The velocity of an RC plane with respect to surrounding air, or true airspeed, is never the main issue for the RC pilot. However, it is intriguing to be able to use the same instruments used on full-size airplanes. Tested air data system can record, but not only, true airspeed and altitude, the readings are real-time compensated by the air data computer. We will review here a DIY Pitot-Static probe used with a DIY air data computer; we installed the equipment on a SkyEye RC plane; you can build by yourself your own air data system, complete with probe, software, and Android App, using the BasicAirData site free media.
The use of the Asgard Air Data Computer on an RC plane is straightforward. We’ve used the experience of a friend aeromodeller and Basic Air Data supporter, MT, to carry on some RC test. He tested the basic workflow/toolchain; all the team is grateful for Marco contribution!
The finality of the tests

Figure 1 – Supplementary support above the servo tray
The mission is not performance testing. The finality of the trials is to seek and fix any issue related to ADC Asgard hardware installation and usability.
System layout
The material under test is one ADC Asgard in a default configuration, one flanged 8 mm probe, and Air Data Bridge software for Android. During the flight testing, a standard USB power bank powers the Asgard ADC. The use of an independent power source, galvanically isolated, is the best way to ensure that there is no interaction with the standard RC hardware. All the hardware has been installed by the pilot. For debugging purposes, we have installed on the plane a smartphone with GPSLogger App.
RC Plane
The selected flying platform is a 2 m wingspan SkyEye by Hobbyking. The model is elementary to assemble, plenty of room to install air data related payload, and it is also not too expensive. Due to a low wing-load, the flight of this model is pretty slow.
Pilot’s notes
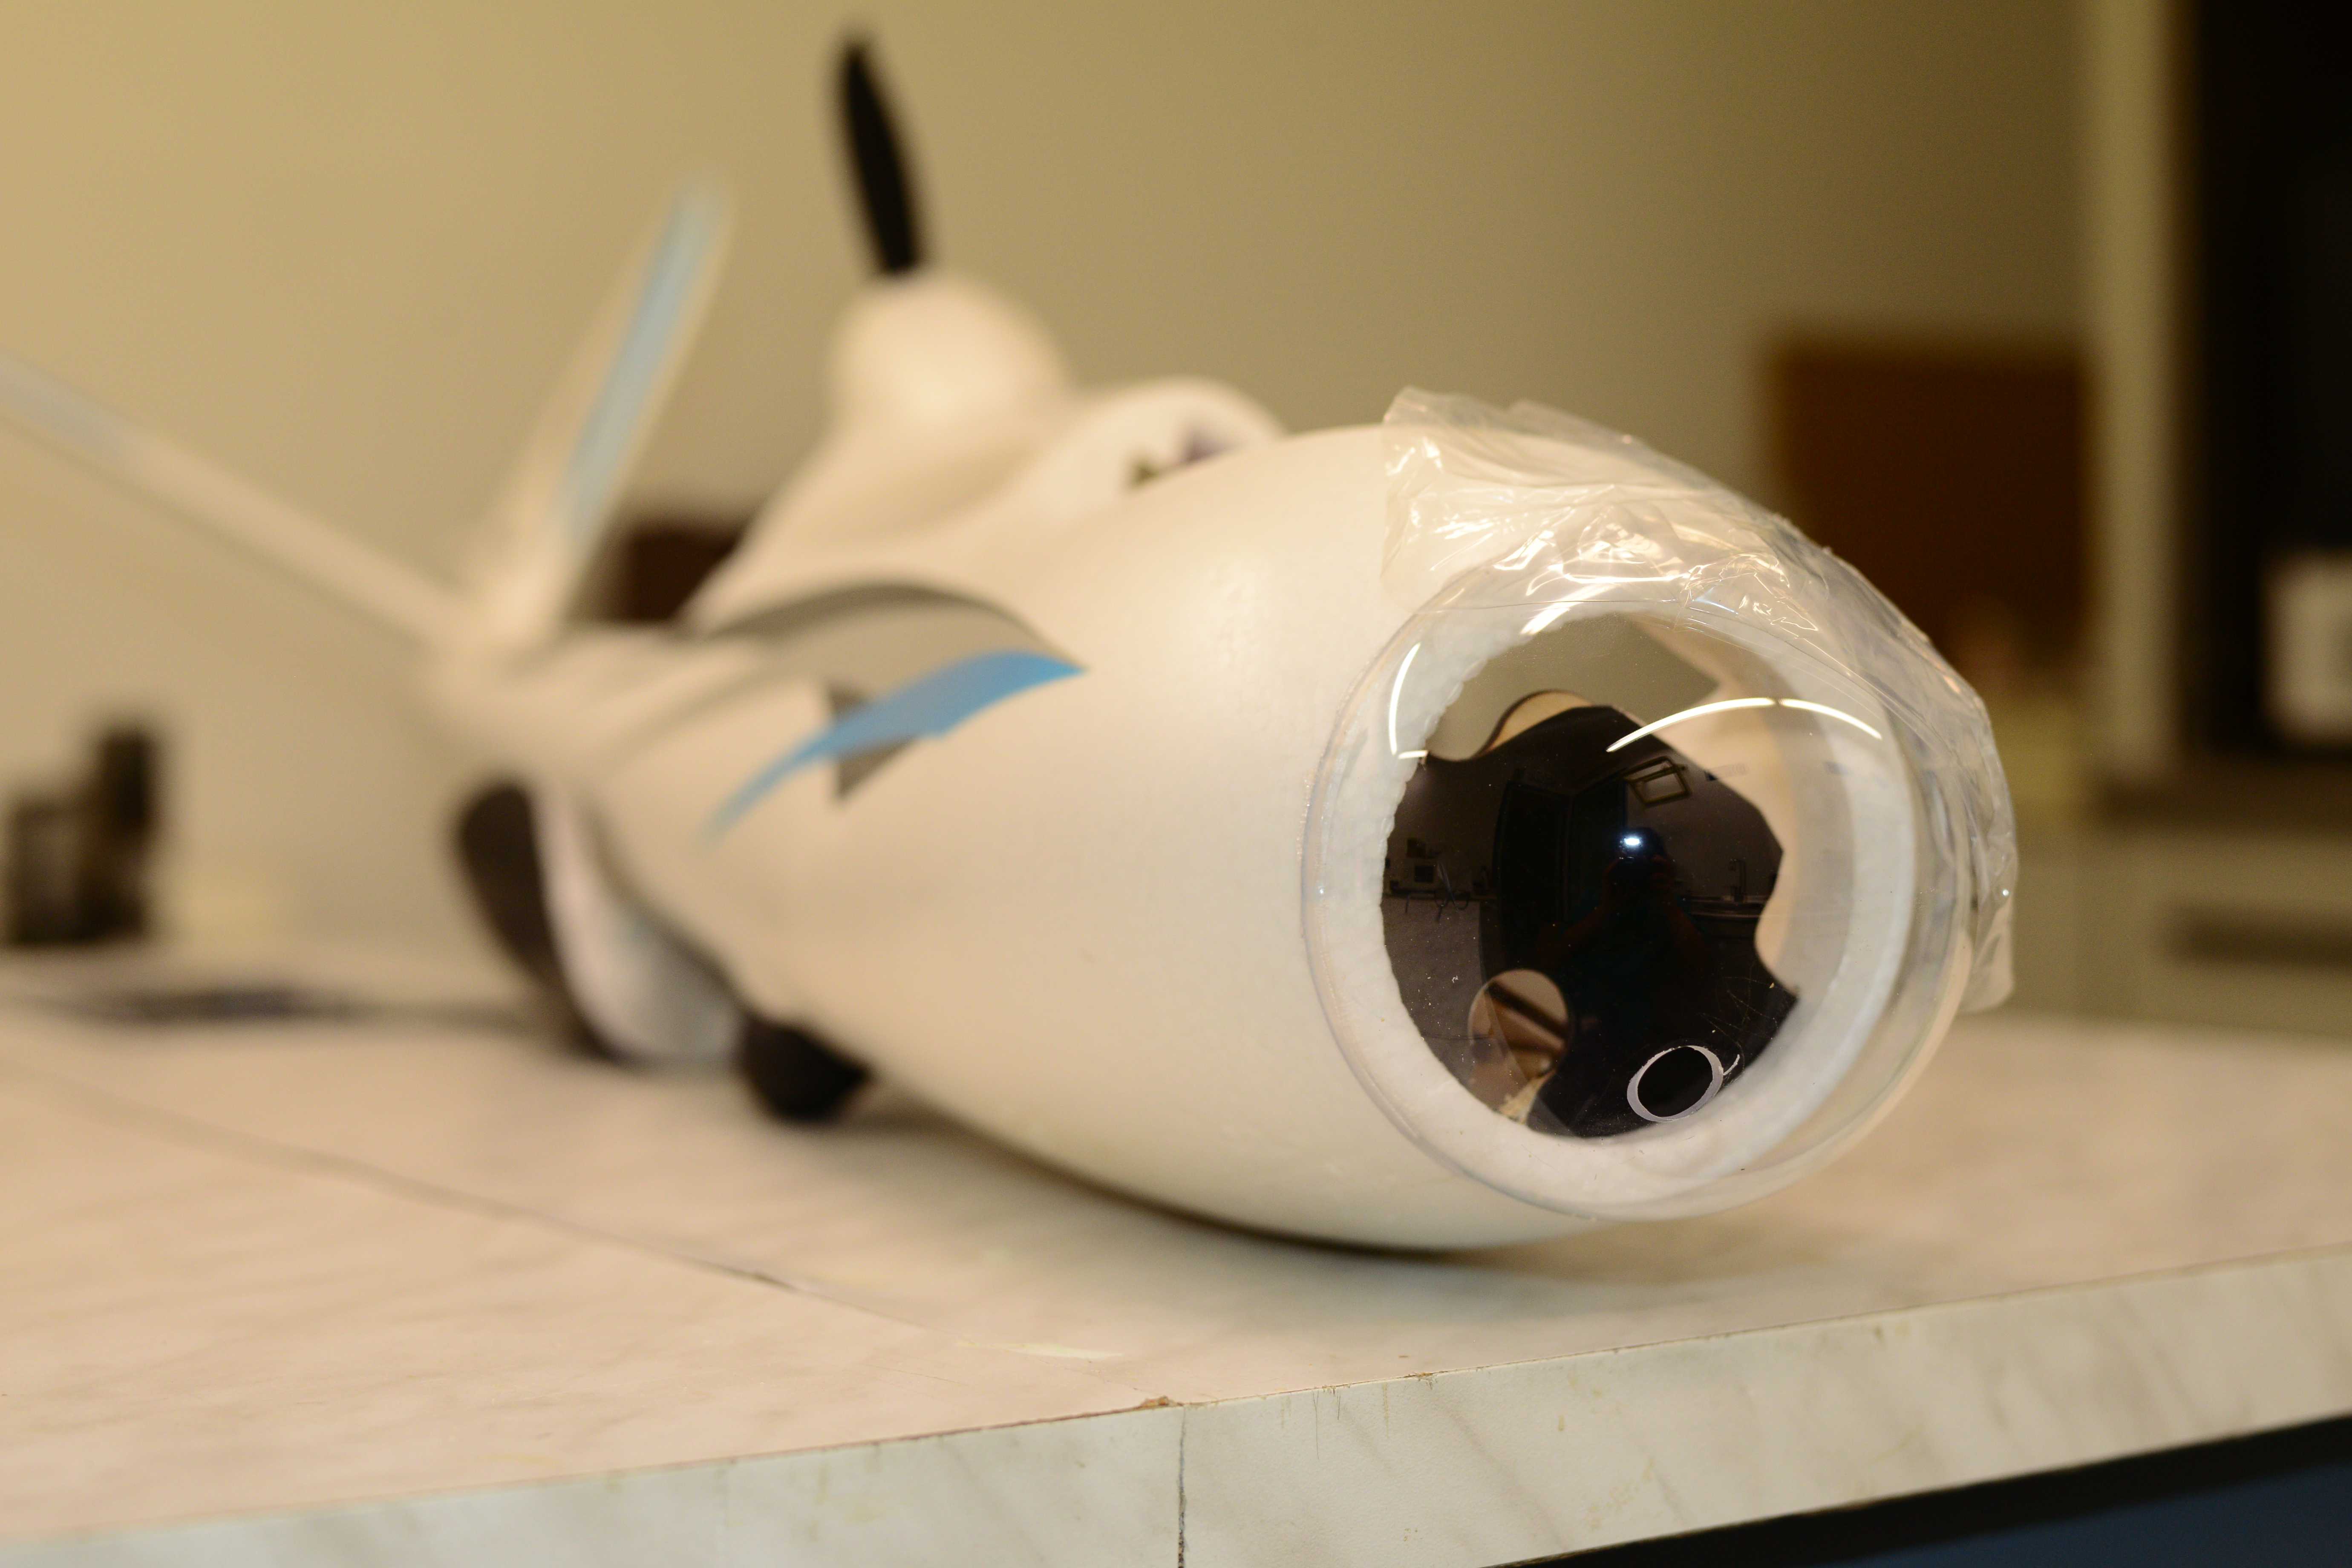
Figure 2 – The hole for the Pitot
The selected plane has a great load capability, both in terms of volume and weight, so the installation is not complex. I glue a custom-made plywood support (Figure 1) to easily screw down the ADC and the Pitot in the right position: pointing straight toward the incoming airstream.
Another preliminary operation was to drill the transparent bubble nose(Figure 2) to allow the Pitot to pass; since the diameter of the probe is 8 mm a slightly bigger bore is adequate, let’s say about 10 mm is fine.
The ADC come with a temperature sensor, the sensor should be placed outside the cabin and possibly not in the airstream and not exposed to direct sunlight; let’s say the best location is inside an outside air temperature probe. Anyway, I used the plug from a silicone cartridge to hold the sensor in place and shield it; I placed the plug all way through the cabin wall (Figure 3).
One significant operation is to seal the space between the pitot and the transparent bubble, I used plasticine. You can see the result in the following gallery and Figure 3.
I screwed down the Pitot with four standard servos screws. The ADC comes with standard servo tabs, I fitted in standard grommets and used two screws to fix the ADC to the airframe. In this case, the plane is electric powered, the grommets come handy when dealing with combustion engines vibrations.

Figure 3 – Note the Temperature sensor housing
Then I pneumatically connected the ADC to the pitot probe flange, + port to the rear barbed port and – port to the front barbed port. I used standard 2×1 fuel line for glow engines. I carefully checked that my routing was not bending nor pressing against the silicone tubing. After that I connected the temperature sensor to the ADC, the sensor has a standard servo connector; if needed the cable can be extended with standard extension servo cable. After that, I strapped the smartphone power bank to the servos support. With that last operation, all the hardware is in place. The standard receiver and servos are insulated from the ADC power source, so the installation of standard avionics do not require any modification.
I checked the center of gravity, it was on the main spar, that was lucky. Unfortunately, I needed to install also a cell phone(100 grams) for GPS Logger, that moved the COG and I needed to add 20 grams of lead on the fuselage in front of the tail. Is to be noted that I made the maiden flight of the SkyEye few months ago, so I know that everything on the model is working fine. With the same prudence, I powered up every device that should be used for the test and carried out a radio range check with the plane in flight configuration. I didn’t want to sink to the ground the Pitot probe.
The air data system is able to record altitude and airspeed so I planned to fly the plane at different altitudes to check out a little the recorder data with GPS data.
We used the GPS data to compare with air data, airspeed, altitude, and to have the possibility to visualize the trajectory on Google maps. The wind during the test was variable, with gusting; the dominant direction was east-west nord, and est-sud.
At the airfield
After the usual pre-flight check I plugged in the power bank and launched the Air Data Bridge application. I then started the recording and gave the name “test1R” to the track. As I decided to use a GPS I turned on the GPS Logger too.
I took off and began to fly in an oval pattern, after fives minutes I landed and stopped the recording of both the GPS and the ADC. Do not unplug the ADC immediately after the landing, you need to close the recording from the Air Data Bridge application. I set up the ADC to record at 50 Hz, so the log files grow really fast with time. Consider using the lower sample rate suitable for your application.
See ADC flight test picture gallery here
Download of data

The data can be downloaded with the Android App Air Data Bridge or directly from the ADC microSD. We used the latter method because it has the higher transfer rate. We saved the data under the “TEST1R” name so we moved the “TEST1R.csv” file to our script folder. In a similar way, we copied the data from GPS Logger folder to the script folder, we renamed the file “TEST1GPSR.csv”. (If you don’t have GPS data the script will work anyway)
Data plot
You can visualize the data with the application you like the more or use the “CSVLoader.sce” script, you find here a video of script launching procedure.
To visualize and process the data we have used a dedicated script for Scilab, prior to use it you need to copy the whole folder of scripts to your computer (click here to download the complete zip file ) and have a working installation of Scilab(Tested with Release 6.0.1 ).
The script to execute is CSVLoader.sce, note that the names of the data files are hardwired at lines 10 and 11.

Figure 4 – QGIS import and plot
Data reported is a lot, the time plots are reported in milliseconds. With Scilab is possible to resize and adapt the graphics with no hassle. CSVLoader.sce script will generate also a file names “FORQGIS.csv”, that file can be imported by commonly available GIS software as QGIS. GIS offers a lot of possibilities, for example, you can draw the velocity vectors along the path; that is shown in Figure 4.
Pilot’s Conclusions
I’m enthusiast about the ADC for the attention to the detail, usability, stability, and robustness. Recording and analysis were easy with the Air Data Bridge interface, it should be useful to add a real-time timer and a byte counter to the app. The use of bulk data on 3D plots hinders figures readability. Maybe reduce sampling frequency can alleviate the issue. The dimensions and weight of ADC are so contained that installation is manageable on two meters class RC planes.
Basicairdata Team
The general impression after the test is positive, no particular issue reported. We will continue testing and improving the air data system under the RC modeler point of view. We owe a debt of gratitude to the tester MT, GC, and JLJ. (NOTE: Data files have been altered)
