Attention. The page needs reformatting. If you think you can do better, please contact us 🙂
This page is a merge of different posting
The angle of
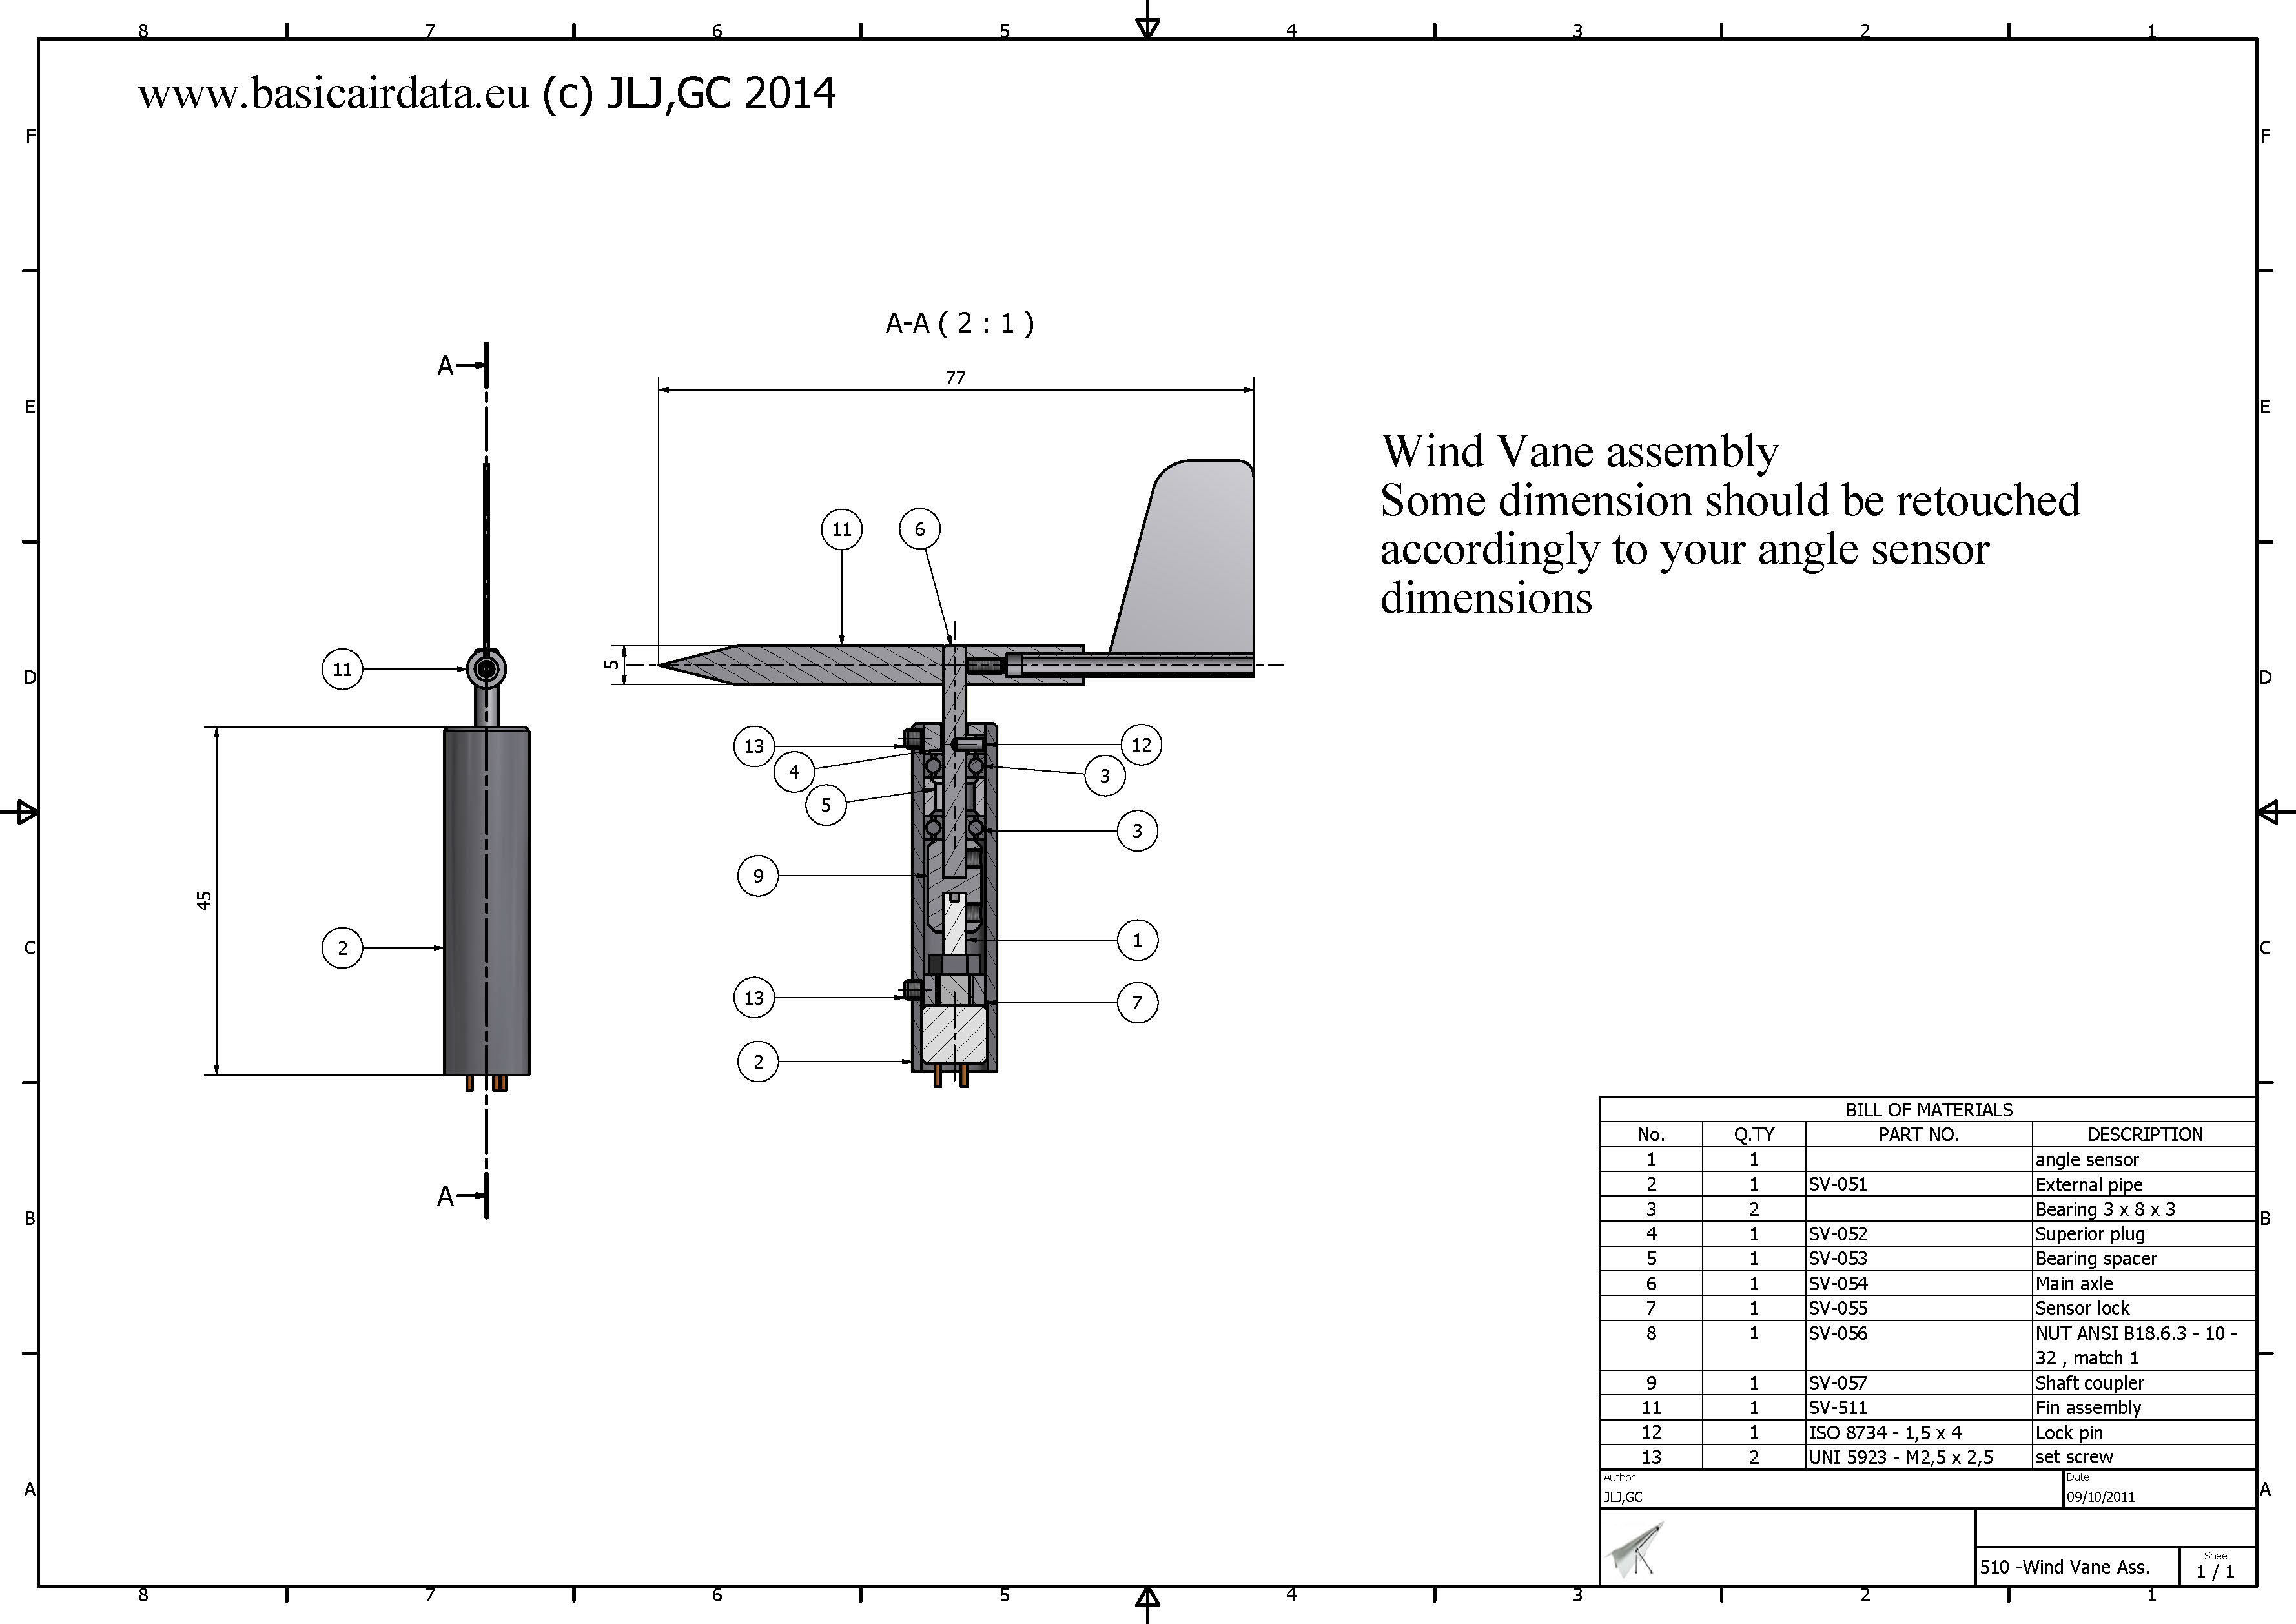
Angle of attack can be measured by mean of a mechanical wind vane. Here below detail drawings for make your own vane, some dimensions can vary from this exposed example.
This kind wind of vane can be used as stand alone unit or integrated into an airdataboom or in a alfa-beta vane.
Introduction
We introduce the angle of attack measurement using wind vanes. The topics to be covered in this section are design, practical issues, modeling and model cross-validation.
The angle of attack (AoA) instruments measure the angle between the airspeed vector and a predefined line on a cross-section of the airplane wing. This line is usually selected either as the zero-lift line or the chord line of the airfoil. AoA is often indicated by the Greek letter ![]() . This angle is often used to calculate the lift of said wing section. AoA vanes are also called alpha vanes. AoA usually changes across the wingspan of the aircraft and this is something one should take into account. A visual example is a wing which twists progressively across its span, flying straight and level. The AoA at the wing root differs from the AoA at the wing tip by the wing geometric twist term. AoA measurements are useful for parameter identification, general aviation planes or even to FPV pilots of
. This angle is often used to calculate the lift of said wing section. AoA vanes are also called alpha vanes. AoA usually changes across the wingspan of the aircraft and this is something one should take into account. A visual example is a wing which twists progressively across its span, flying straight and level. The AoA at the wing root differs from the AoA at the wing tip by the wing geometric twist term. AoA measurements are useful for parameter identification, general aviation planes or even to FPV pilots of
- Wind vanes
- Null seeking devices
- Static-type devices, based exclusively on pressure measurement
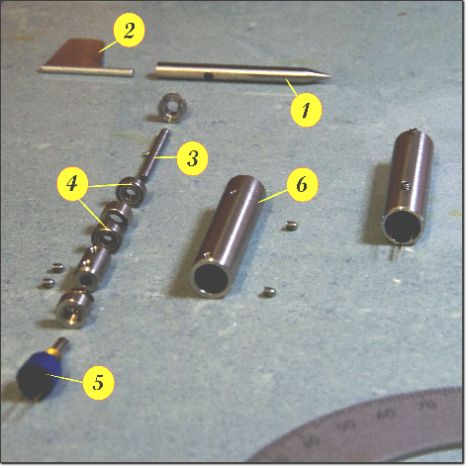
Figure 1: Miniature DIY Wind Vane detail (JLJ and GC); Caption – 1 Counter weight
, 2 Fin, 3 Main rotation shaft, 4 Bearings, 5 Potentiometer, 6 vane body
Equally important to the instrument itself, is the definition of the quantity under measurement: an adequate design requires stating specifications beforehand. Initially, our focus will be turned towards common design aspects and then some specifications will be proposed. A lot of references regard weather vanes specifically; in principle, it’s a valuable resource but not very helpful when it comes to design requirements.
There are two main macroscopic differences between
![]()
Given an airspeed of 20 m/s and a maximum deflection of 20 mm at 10 Hz, the error is:
![]()
Another issue to be taken into account is that the motion of the mount at the wind vane mounting point can interact with the wind vane dynamics. To avoid performance degradation it is crucial to
A 3D model needs to be created in a computing environment and FEM modal analysis be carried out. Alternatively, lab tests are also a way to obtain such data. Figure 3 depicts the first mode of the probe. Elmer is a notable open FEM package that can be freely downloaded and can handle dynamic analysis.
Generally speaking, the stiffer the airboom, the higher its first resonant frequency will be. Higher airboom resonant frequencies are desirable, since they present an uppper performance limit for the wind vane. As a rule of thumb, if the airboom assembly moves under a slight force of the hand while while fixed on the ground, some vibration-related problems are to be expected.
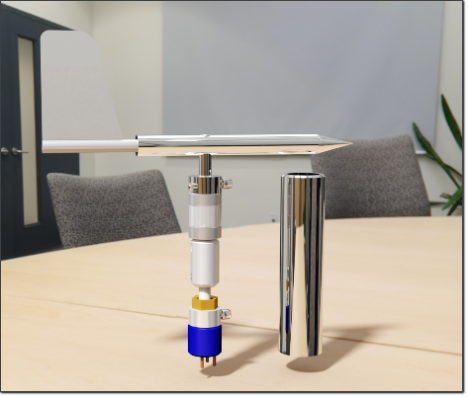
Figure 2: Miniature DIY Wind Vane 3D model (JLJ and GC)
More accurately, if numerical analysis tools is available, make sure that the first resonant frequency of the airboom is far from the desired wind vane operational range. An offset of at least 0.3 times the first mode frequency is a good, conservative value.
Resonant frequencies of higher order can be usually neglected, as they carry significantly less deflection energy. For best performance, it is always a good idea to make sure that to other vehicle components create excitations in the low to mid frequencies of the wind vane.
Let’s proceed by examining wind vane behavior; refer to Figure 1.
The most critical components are the bearings. A Coulomb friction model will be used to describe their static friction.
The phenomenon of static friction, or stiction, results in the torque that is necessary to start rotating a resting bearing being greater than the torque required to keep it rolling. A graph representation of this phenomenon is found in Figure 4. This non-linearity leads to some problems when it is incoroporated in numerical integration algorithms.
Firstly, longer integration calculation times are to be expected. Furthermore, limit cycles and solution collisions may be generated, in other words the solution may be non-steady/cyclic or converge to a terminal value that yields a non zero static tracking error.
Analysis can become much neater if the model is writen down as a Filippov system: a nice, sliding bifurcation arises.
ny articles are available on the wind vane topic, for
ommonly, the vane dynamic behavior, at least near equilibrium, can be assimilated as one of a second order underdamped system. Standard industrial methods for determining the dynamic performance of a wind vane also exist, for example ASTM—D5366 “Standard Test Method for Determining the Dynamic Performance of a Wind Vane”.
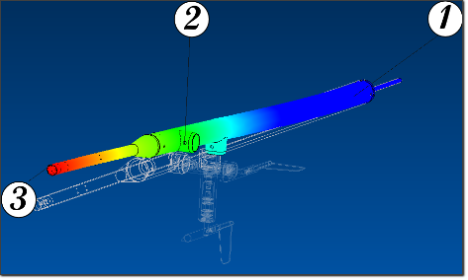
Figure 3: Modal analysis on the probe, first mode frequency is 106Hz. The probe is fixed at the root. The Maximum deflection at the tip 3 is 25 mm, 16 mm at the 2 windvane
fixation point and 0 mm at the root 1.
Design
Modeling the dynamics of the wind vane as a second-order system, we end up with two significant parameters of the system: resonance frequency and damping. Initially, bearings and other sources of friction on the main shaft will be neglected. A known resonance frequency value is used to verify that the wind vane is not excited by other mechanical devices, as depicted in the previous section. Wind gusts are generally an intended source of AoA readings, but we must ensure that their frequency content does not approach or exceed the resonance frequency, so as the frequency response of our system has unity magnitude. Damping indicates how faster an excited oscillation decreases with time.
The following equation defines a second-order transfer function using common notation. Since our vane will be underdamped, the typical time response will be oscillatory, with an exponential time decay term which reduces the oscillation magnitude in time.
![]()
![]()
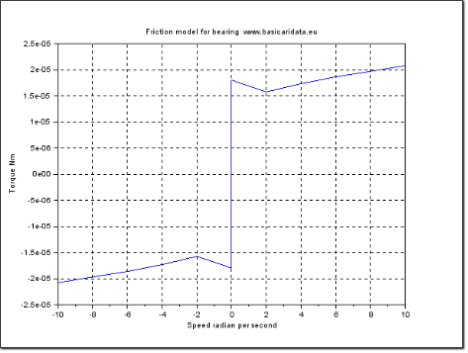
Figure 4: Bearing friction model including stiction
Inspection of the previous figures reveals that for good system behaviour (fast and stable measurements) we need a high value for both resonance frequency and damping. A SciLab file available for experimenting with parameter values can be found here.
To increase wind vane resonance frequency, much like many mechanical systems, inertia decrease is required. Our wind vane is statically balanced with a fore mass and the overall weight can be decreased by enlarging the distance of the counterweight and decreasing the distance of the fin from the rotation axis of the vane. On the other hand, using a long fin arm will increase the damping of the system which is an also desirable characteristic, as is also described here, eq.6.
Thus, we end up with two conflicting requirements in our design phase. If an extremely fast dynamic response is needed, the ideal design is a leading edge wind vane, which is a vane that pivots directly in the leading edge of the fin, with no counterweight.
If high values of damping are required, the classical long-armed wind vane is more promising. Since there is no dominant argument when choosing those values, a value greater than 0,15 is a good start, in order to avoid uncontrolled oscillations during operation.
A damped system oscillates at the damped frequency ![]() of eq.2, as per figure 5b. When damping is low,
of eq.2, as per figure 5b. When damping is low, ![]() is close to the natural frequency.
is close to the natural frequency.
Natural frequency should be two times the maximum frequency of the measured quantity, in order to ensure unity measurement gain. Also, as has been said in the previous post, resonance frequency should be lower than ![]() , or at least, this is a good first estimate; the more distance between the two resonance frequencies the better.
, or at least, this is a good first estimate; the more distance between the two resonance frequencies the better.
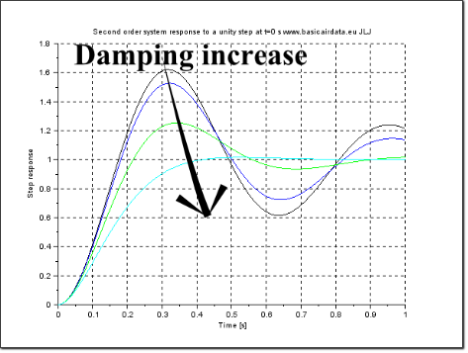
Figure 5a: Second order system step response. Damping values as follows: Black 0,15, Blue 0,2, Green 0,4, Light blue 0,8
In a typical operating scenario, the vane will have to deal with a constant wind, with gusts superimposed on it.
For design and simulation purposes gust models are available, such as the Dryden, FAR and FAR2 models. Wind gust library blocks also exist in many simulation packages.
The Dryden model is based on a stochastic representation of wind gusts. Using the autocorrelation function spectrum of gusts, it creates a filter that produces time domain signals, once fed with white noise. Neither Dryden nor FAR models intend to provide a very accurate result. However, they are useful because they provide us with a probable shape of wind gusts and a base for comparison between vane designs. During the preliminary design
The gust model is used to produce the wind magnitude response on the z-axis. Setting a baseline of zero constant wind, the total wind is assumed to be blowing exactly perpendicular to the ground with upwards direction.
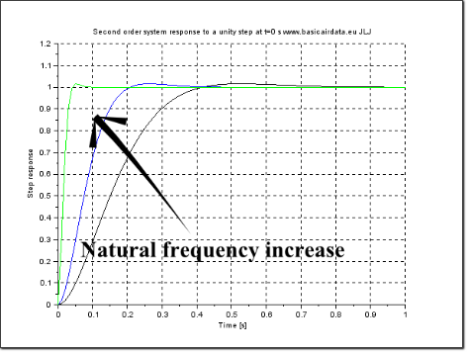
Figure 5b: Second order system step response Natural frequency wn
value as follow: Black 10, Blue 20,Green 100
Recalling that wing section relative speed is equal to the vector sum of
The figure 6.1 depicts a one cosine FAR gust shape. Its wind components are assumed to act independently and only the z-component is shown. Customize the parameters with your test conditions: download the plot file here.
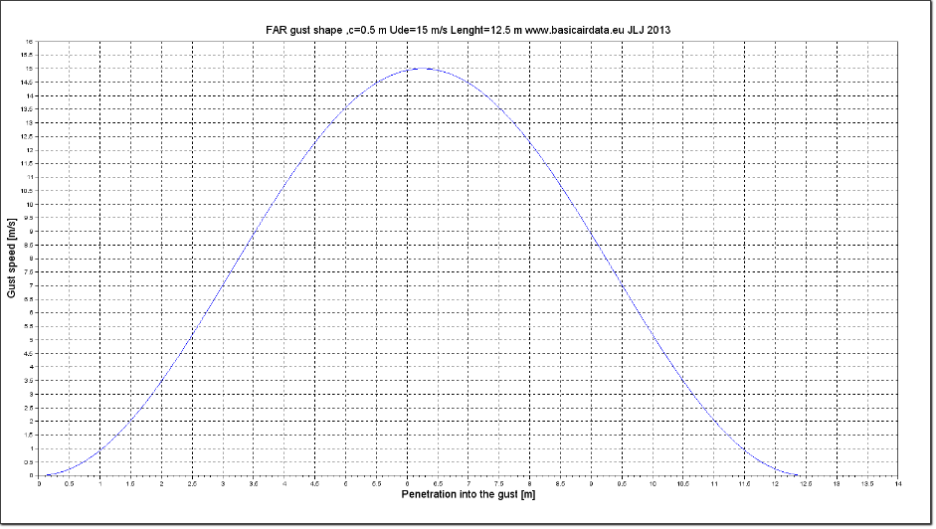
Figure 6: 1-cosine FAR flavor gust shape ude=15m/s
There is no such thing as correct gust parameters; during the design phase a worst case scenario approach will be applied. This scenario should reflect the airboom intended use and the flight platform on which it will be mounted.
The length of the gust gives us an indication of what is the impact of the vane dimensions on its accuracy. In short, it’s impossible to measure a 10 cm gust with a 25 cm vane, since given this size, the tip of the vane would be immersed in one gust while the tail still lies in the previous one.
It is useful to define the minimum steady wind path length required for a stable AoA reading. This parameter has been mentioned by many authors and is usually referred to as the decay resistance. It can be calculated for a given wind vane and is the distance which the instrument should travel into the gust to reach a given percentage of the final AoA value, starting from a different AoA value. A typical wind vane response can be viewed in figure 7. Compare with a wind tunnel test from 1974 by AMIES T. KARAM, TECHNICAL REPORT AFIT TR 74-8 [1]
An ideal airborne vane has a decay distance equal to zero, but for the proposed vane a 50m value is a good starint point. However, this value only leads to a static performance specification and doesn’t correlate with dynamic behaviour. According to Figure 6, the gust has a maximum derivative value equal to ![]() .
.
In order to place a lower bound for the vane performance, we can inspect the time response of our system to the ramp
![]()
From table 3 in this reference link, we get the time response of a second order underdamped system to a ramp input; the time domain output is the sum of a ramp, an offset and an oscillating term.
![Rendered by QuickLaTeX.com \[y_s(t)=\frac{1}{omega^2_n}\bigg[t+\frac{e^{-\zeta\omega_nt}}{\omega_n}\bigg(2\zeta cos\omega_dt+\frac{2\zeta^2-1}{\sqrt{1-\zeta^2}}sin\omega_dt\bigg)-\frac{2\zeta}{\omega_n}\bigg]\]](https://www.basicairdata.eu/wp-content/ql-cache/quicklatex.com-81acc7f8d5df700cfde93ccc464f0151_l3.png)
(Equation AoA 3 – Standard second order system unti ramp time response)
The third term, a pure offset error, decreases as natural frequency increases. The second term is dominated by a time constant of magnitude ![]() , hence the oscillatory behavior can be reduced also by a
, hence the oscillatory behavior can be reduced also by a ![]() increase.
increase.
Before proceeding, we summarize the simplifications and the parameters that will be further employed.
Simplifications:
- The sensor is ideal: only the mechanical part is under analysis
- Aerodynamic interactions between the different parts of the vane are neglected
- Bearing friction is considered at first negligible, no stiction phenomena. The bearing impact will be accounted for in a secondary phase
- Model is valid only for small AoA values, wind tunnel tests confirm that linear models don’t hold for high AoA values
- Gust models are not expected to be accurate for very low altitudes, about under 100m. At any rate, gust shape is taken as a reference shape for performance comparison purposes
- Windvane support is “stiff enough” and considered as fixed. As was previously discussed, it is imperative that no mechanical interactions occur between these two components.
Also any other form of mechanical interaction/resonace with flying components have been checked and/or excluded
Performance parameters, notation, design goals initial value:
- Operating speed range, (10m/s,60m/s) Derived from intended use / flying platform specifications
- Operating AoA range, (-30°,+30°) Derived from intended use / flying platform specs
- Vane static measure offset,
 ,
,  , Can be defined according to the application requirements
 - Vane resonance frequency,
 , 20 Hz. A higher value reduce sthe ramp tracking error
 - Vane Damping coefficient,
 , >0,15.
  should be minimized for good ramp response. High damping warrants a fast response to measurement variations
 - Decay distance,
 ,
, 
Below is a list of geometric parameters, consistent with this reference [2]
- Fin aerodynamic center distance from rotation axis

- Counterweight distance from rotation axis

-
Angle of attack, AoA. In thereference thegreek letter is used for yaw since they are considering a meteorological
 windvane . For our application as usually denoted we will use thegreek letter alpha
Relevant aerodynamic parameters are
Aspect ratio of the fin , where
  is the fin
 fullspan and the fin surface
- Coefficient of lift and drag
 and
and 
- Now that the wind vane design requirements have been set along with its performance bounds, it’s time to explicitly correlate the vane geometric and aerodynamic characteristics to performance parameters.
Numerical Example
After all the mathematical background has been laid out in the two previous sections, the design procedure based on a numeric example will be discussed. Refer to the following scilab file: it’s a simple script file to evaluate the windvane parameters. For the sake of simplicity, when possible, the nomenclature is that of the common, freely available, reference “Wieringa (1967),Evaluation and Design of Wind Vanes, Royal Netherlands Meteorological Institute, De Bilt” By the end of the post a compact set of equations and a basic procedure for wind vane sizing will have been presented.
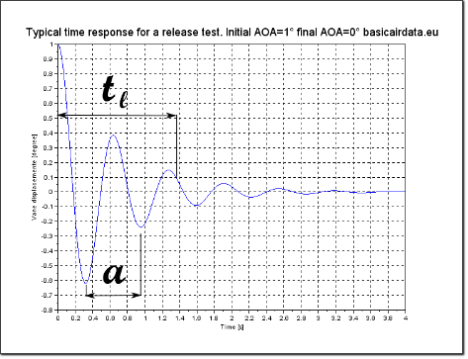
Figure 7: Typical Windvane simulated release test,
is the equivalent in time of decay distance .ζ=0,15, wn=10 1/s, wd=9,88 1/s Oscillation period =0,635 s
The design process is recursive and requires going back and forth through the specification, 3D design and performance evaluation phases. Strictly speaking, finding the best
Executing the Scilab file will return the following output, that summarizes parameters of the provided example wind vane design:
Vane parameters Table 8.1
- Windvane weight 8.00 grams
rv lenght rw lenght
The vane calculated parameters
- Fin surface 380.95 mm^2
- Vane inertia 0.000006 kgm^2
- Natural frequency 72.63 rad/s
- Damped frequency 72.60 rad/S
- Damping ratio zeta 0.030
- Decay distance 92.3 [m]
Shaft condition >> no friction
- Relative wind speed 30.00 m/s
- Alfa value 0.10 degrees
Shaft condition >> no friction
- Relative wind speed 30.00 m/s
- Alfa value 0.10 degrees
- Aerodynamic Torque 5.75e-05 Nm
Shaft condition >> viscous friction
- Viscous friction term Dm 2.000e-05 Nms/rad
- Damping ratio increase due to viscous friction 0.022
- Total damping
ratio 0.052 - Table 8.1 – Scilab script output, run this wind-vane specific SciLab file
Consider the proposed model for the main shaft bearing friction in Figure 8.1. The friction curve is over-estimated so that the torque values are conservative. To be more general, consider also that torque values are the sum of the torque generated by all friction sources on the shaft, including those caused by the position sensor.
Table 8.1 reports the approximate torque generated by the lift of the fin at the shaft: 5.75e-05 Nm for a wind blowing at 30 m/s. The aerodynamic torque that our vane generates for an ![]() of 0.1° at 30 m/s is greater than the torque of 2e-5 Nm necessary for the shaft to begin to rotate. At 30 m/s the vane will hopefully correctly rotate to 0.1°
of 0.1° at 30 m/s is greater than the torque of 2e-5 Nm necessary for the shaft to begin to rotate. At 30 m/s the vane will hopefully correctly rotate to 0.1° ![]() .
.
In a different scenario, if the speed is reduced to the lower bound of
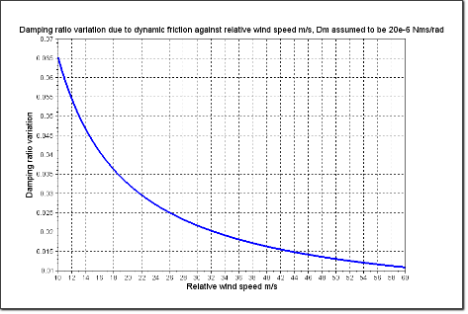
Figure 8.2: Damping ratio against relative wind speed, Dm assumed to be 20e-6 Nms/rad
This result is obtained with the following reasoning:
Assume that the force produced by the ![]() . By dividing the static friction torque at 0.1
. By dividing the static friction torque at 0.1 ![]() , we can calculate the multiples of 0.1
, we can calculate the multiples of 0.1
Given
Nstatico>>storque, where N is speed dependen
With our example numeric values 0.00366330,1/3606,28>>storque, storque<<6.4e-6
In those cases where it’s not possible to reduce the friction, it is necessary to increase the wind vane fin area, so that the vane will generate more torque.
Table 8.1 shows a low damping ratio, quite different from our initial requirement of a value greater than 0,15. Recalling that our current model neglects the bearing damping some considerations should be added for a correct interpretation of the results.
Note that when wind speed is very high, since friction torque contribution is small compared to the torque generated by the fin, the behavior of the vane will be essentially as predicted by the model. A very lightly damped response should be expected. At lower speeds the contribution of friction is not negligible and leads to an increase in the response damping.
Wieringa Eq.30 add a viscous term proportional to rotation speed to the ideal case model. No static friction is considered. Other authors, for
Again, according to Wieringa the damping ratio variation against relative wind speed is plotted on
In order to add damping at higher speeds, some mechanism, either aerodynamic or mechanical, can be employed. The example probe does not use any such means to compensate for relative wind speed.
The whole design process is somewhat recursive. The following Figure 8.3 depicts a possible design development path.
Pay attention to the fact that post-design simulation and testing should be carried out on the vane. Although this part is not treated here, this validation is considered a significant point in the overall design procedure.
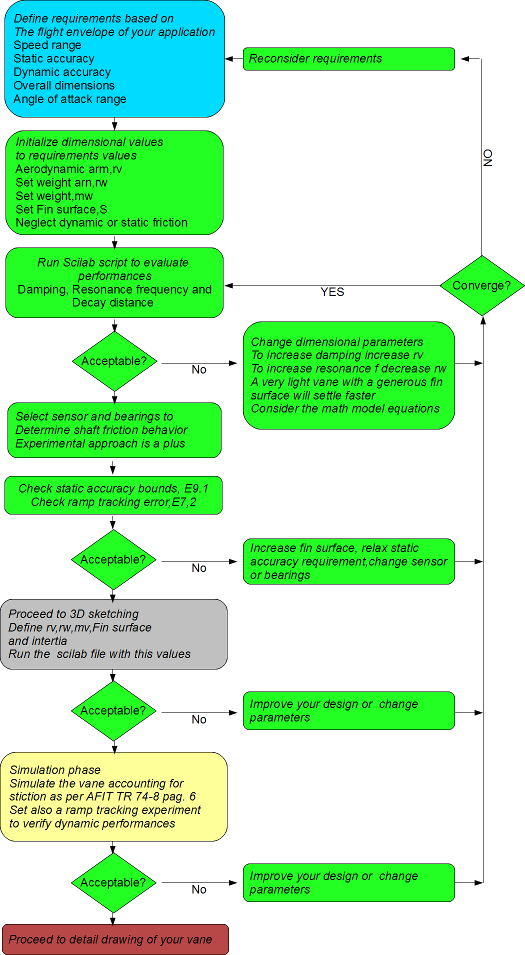
Figure 8.3: Possible design process development flowchart
References
[1] J. T. Karam, “Dynamic behavior of angle-of-attack vane assemblies,” Journal of Aircraft, vol. 12, no. 3, pp. 190–192, Mar. 1975 [Online]. Available: https://arc.aiaa.org/doi/abs/10.2514/3.44432
[2] J. Wieringa, “Evaluation and Design of Wind Vanes,” Journal of Applied Meteorology, vol. 6, no. 6, pp. 1114–1122, Dec. 1967 [Online]. Available: https://journals.ametsoc.org/doi/abs/10.1175/1520-0450%281967%29006%3C1114%3AEADOWV%3E2.0.CO%3B2 [
0 Comments
Leave a Reply
You must be logged in to post a comment.